Does increased LC peak capacity equal increased value for complex sample analysis?
The meaning of peak capacity
Despite the strength of liquid chromatography (LC) to separate compounds through well tunable selective retention, its efficiency lags behind gas chromatography (GC) that can deliver up to several millions of plates per column. Resolution improvement in LC should thus be addressed with selectivity optimization first. If samples get too complex, however, this approach is no longer feasible, as improving selectivity in one part of the chromatogram will automatically negatively affect peak resolution in the neighborhood. Hence, higher efficiency is the best way to resolve complex chromatograms. Small particle phases in long columns make best use of modern UHPLC pressure capabilities to boost efficiency further. Two-dimensional LC (2D-LC) is another powerful way to a significant increase of separation power. A common measure for the separation potential in chromatography is the peak capacity nC. This is the maximum number of peaks that can be separated with a resolution of R = 1.0 if equally distributed over the entire chromatogram. Moreover the peaks should be symmetrical and of similar size to estimate nC directly from column plate numbers (N). As real life separations are mostly far away from this ideal world, peak capacity is often challenged for its practical relevance. We will assess examples for one-dimensional and a two-dimensional method on how peak capacity translates into analytical benefits.
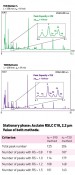
Fig. 1: Comparison of generic exploratory method for traditional Chinese medicine run on a Vanquish UHPLC system with two different column lengths. Other conditions were as follows. Column id: 2.1 mm, L = 400 mm setup : coupling 150mm and 250mm columns with Thermo Scientific™ Viper™ coupling device, gradient : from 0% to 100% acetonitrile, flow rate : 670 µL/min, column temperature : 45 °C.
Estimating peak capacities from column plate numbers
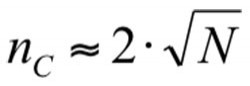
Gradient methods can generate peak capacity higher by a factor of two than isocratic methods on the same column in a similar analysis time. The reason is that in isocratic elution peak width steeply increases with retention time, whereas in gradient elution, peak width is not as much affected by retention time. In fact, peak width is often regarded as quasi-constant throughout the chromatogram. Hence, gradient elution is a must to resolve complex samples. Formulas to calculate the theoretical nC in gradient methods are advanced and depend on retention parameters that may differ for the individual components of a sample. To estimate nC, in a common wide range reversed phase gradient for complex samples, where the organic content changes by at least 60% and the gradient volume VG exceeds by at least 30 times the column flow-through volume VM, the following formula can be applied:

Considering maximum plate numbers of 100,000 < N < 150,000 for long UHPLC columns or coupled columns, it is possible to achieve peak capacities of 600 to 800 on a column length of 40 to 50cm. Under a pressure of 1200 to 1400bar, such columns can be run at their maximum efficiency with approximately 5mm/s linear velocity. This allows for a tM of about 1 min so that gradients with VG = 30 x tM can be run in about half an hour. While this is an impressive peak production rate of 25peaks/min, the absolute peak capacity remains limited in 1D-LC.
Extending to a second chromatographic dimension enables peak capacities of 3000 to 5000 because the total nC is now a combination of both dimensions according to the following formula:
2DnC = 1nC x 2nC
This rule only applies if the following three prerequisites are fulfilled:
// Combination of two orthogonal separation mechanisms, through independent retention and selectivity criteria in both dimensions
// Coverage of entire retention space in both dimensions, by distribution of peaks from lowest to highest retention in first and second dimension
// Optimized sampling rate from 1st dimension by collecting twice as many fractions as its peak capacity
None of the three criteria can be easily met, but the third mainly affects the overall analysis time. Even with a very fast method of 2.5min cycle time in the second dimension, analyzing 100 fractions from the first dimension to preserve >sup>1nC=50 would result in more than 4 hours analysis time. Such a 2D-LC setup could theoretically come close to the impressive number of nC = 10,000, which would be equal to a production rate of 40 peaks/min. Besides the significant instrumental challenge involved, such 2D methods can hardly be achieved in practice. Typical 2D peak production rates are lower than in 1D-UHPLC. Normally much lower numbers of fractions than 100 are transferred from the first dimension. Therefore the peak capacity in the first dimension is relatively meaningless and always limited by the number of fractions in practice.
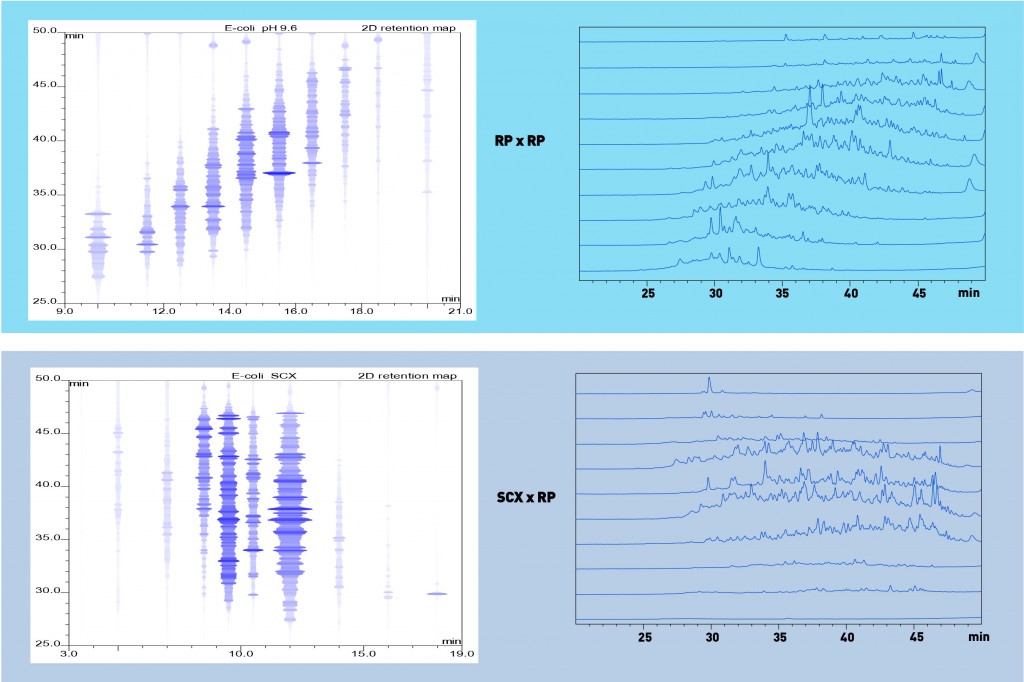
Fig. 2: Comparison of two different automated off-line 2D-LC analyses of E. coli tryptic digests run on a Thermo Scientific™ UltiMate™ 3000 RSLCnano system, with WPS-3000TFC autosampler with fraction collection and re-injection option. 10 fractions of 1minute were collected from 1st dimension into 384 well plate. 1st dimension run on 300µm id, 150mm length capillary columns at 6µL/min flow, 2nd dimension run on 75µm id, 150mm length nano columns at 300nL/min flow. SCX column was a PolySULFOETHYL Aspartamide, 5 µm run in a phosphate buffer pH 3 with salt gradient up to 0.6 M NaCl in 15min. All RP columns were Thermo Scientific™ Acclaim™ PA2 5 µm. First dimension RP was run at pH=9.6 with triethylamine and gradient to 50% acetonitrile in 15min. Second dimension RP (both methods) was run at pH=1.9 with trifluoroacetic acid and gradient to 50% acetonitrile in 30min.
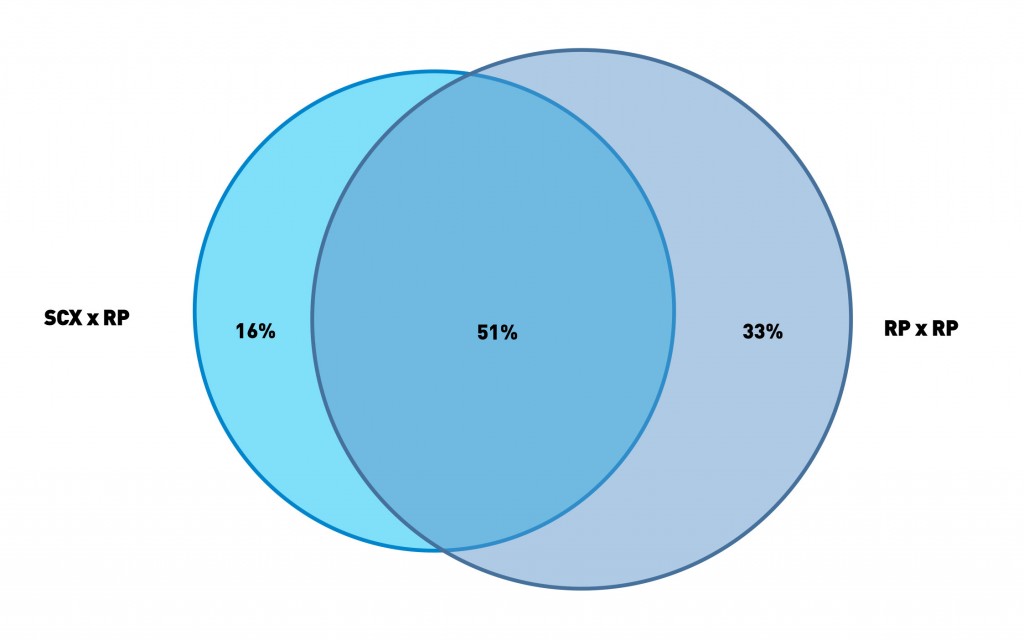
Fig. 3: Venn digram to show the complementary performance of the two methods from Figure 2. Ratio of proteins are shown as identified from MS/MS identficiation using an ion trap mass spectrometer and search against a Mascot™ data base (Matrix Science Inc.).
1D-UHPLC example for the untargeted exploratory assay of traditional Chinese medicine (TCM)
Like most natural products, TCM samples are normally very complex and can contain hundreds of compounds that are relevant for a screening assay to characterize them. Figure 1 demonstrates how the use of 2.2µm particles packed in long columns facilitates such TCM analyses. The original method on a 250mm column with gradient duration of 18min yielded a peak capacity of nC = 590 and created a pressure of 915bar at the start of the gradient. To fully exploit the 1500bar pressure capability of the Thermo Scientific™ Vanquish™ UHPLC system, the column length was extended to 400mm and the gradient time to 29min to further increase the peak capacity. The pressure was now at 1360bar, but a peak capacity of nC=720 was determined for this method. This increase of 22% followed well the theoretical expectation of a peak capacity increase with the square root of the column length extension under respective gradient adaptation. A zoom into a particular part of the chromatogram shows how the improved method provides better resolution. Of interest was the overall benefit of the method with increased peak capacity and how this can be quantified in such a screening method where peaks are not identified. The table in Figure 1 shows some figures of merit to compare both methods. Under defined integration parameters the overall number of peaks, as well the number of peak pairs with a certain resolution is depicted. The number of identified peaks was more than 60% higher on the 400mm column setup. Even more relevant are the statistics on the peak pair resolution. At all resolution levels the improved method provided more than 50% additional peak pairs to meet this criterion. At the relevant R = 1.5 level the gain was even more than 50%. At least for this TCM example, the result is a clear proof of the practical value of nC to improve methods for complex samples.
2D-LC/MS method comparison for proteomics workflows
Bottom-up proteomics workflows use LC/MS peptide mapping after digest of the sample with a protease. They then identify proteins from characteristic peptide m/z. Bacteria cells like E. coli contain more than 1000 characteristic proteins in a cytoplasmic fraction and, hence, up to 10,000 peptides in a tryptic digest. Figure 2 shows the application of two different 2D-LC methods applied to the same tryptic digest of E. coli. One method combines strong cation exchange (SCX) with reversed phase (RP) separation in the second dimension. The other method uses RP in both dimensions but at significantly different pH values of the mobile phase (9.6 and 1.9). The second dimension provided in both methods nC = 220. Given that the cycle time for the 2nd dimension was close to one hour, only 10 fractions were cut from the first dimension. Hence the maximum peak capacity of both methods was about 2200 (10 x 220). A closer look at the plots reveals that the patterns of the retention space coverage are different between both methods. The RP-RP method showed a pattern where most peaks were oriented along the diagonal which indicates higher correlation and thus limited orthogonality. The SCX-RP method showed more random distribution, but another difference between both methods is also obvious. Most peaks elute in the central fractions from the SCX run and are not so well distributed, compared to the 1st dimension run of the other method (RP at pH 9.6). The effective peak capacity of both methods needs correction by a surface coverage factor, which was graphically determined to 60% for the RP-RP method and only 47% for the SCX-RP method. Therefore the effectively usable peak capacity of the RP-RP method would be approximately 1320 (2200 x 0.6) and for the SCX-RP method only ca. 1030 (2200 x 0.47). The ratio of identified proteins and how the results match between both methods is shown in Figure 3. The method with 28% higher effective peak capacity identified a 25% higher number of proteins (84% vs. 67% of total identified proteins). It is important though, that 16% of all identified proteins could only be found with the apparently less powerful SCX-RP method.
So what can we conclude on the practical value of peak capacity?
A column chain of 400 mm length using a 2.2µm stationary phase yielded a peak capacity of nC=720 in a 36min analysis cycle time when run at 1360bar maximum pressure and supporting a productivity rate of 20peaks/min. When comparing two different column lengths the number of well resolved peaks in a complex TCM mixture increased with the increase of column length. This was exceeding expectations based on peak capacity increase.
A 2D-LC method comparison in proteomics using nano-LC/MS in the second dimension was done with conventional 5µm columns and a very shallow gradient in the 2nd dimension. The overall analysis time was 600min. Peak capacities of up to 1300 could be achieved (after correction with retention space coverage rate). This yields a factor of 10 lower peak production rate but an almost twice as high peak capacity relative to the 1D-UHPLC method.
In a nutshell:
// Peak capacity in 1D- und 2D-LC proved to translate into value for complex sample analysis in different application fields.
// Peak production rates are higher in 1D-UHPLC and peak capacity is usually sufficient, but 2D-LC is the only way to significantly exceed a peak capacity of 1000.
// 2D-LC combines the selectivity from two different methods and improved separation efficiency can only be achieved if the chosen combination
is complementary, as in the example shown in this article.
Picture: © istockphoto.com | PaulCowan
|