Raman spectroscopy for biologists and clinicians
Spectroscopy the bugbear for medical students and technicians: Asked by biologists or clinicians what exactly we are doing at CellTool® we originally answered, that we are developing a unique spectroscopic microscope system that enables easy cell analysis based on Raman spectroscopy. The two “non-words” in the world of biomedical scientists namely spectroscopy and Raman immediately caused to raise hackles and one could see how interest vanished. We gradually realized that this was mainly due to the fact that most of us biologists and physician have heard or had to learn about spectroscopy during our studies. However, those abstract zig-zag graphs reminded us more of a mountain scenery than of a method that could give valuable information about matter or even about biological samples.

Amazingly Raman microscopy can indeed identify and analyze individual cells – alive or fixed – providing detailed information about the actual metabolic status of the cell. We only have to learn how to read and interpret the “zig-zag” graphs of those complex Raman spectra, where all molecules within the laser focal spot contribute and yield a specific sum spectra as characteristic as a “fingerprint”. Most important Raman microscopy measures in a complete non-invasive manner keeping cells unaffected for further investigations or cell therapeutic applications.
Actually there are several high sophisticated pure physical methods that finally made their way into the daily routine of clinical diagnosis and therapy – such as ultrasound, x-ray examination, magnetic resonance tomography (MTR), or positron emission tomography (PET) as well as various laser treatments such as laser lithotripsy or laser treatment of the eye (laser shaping of the cornea).
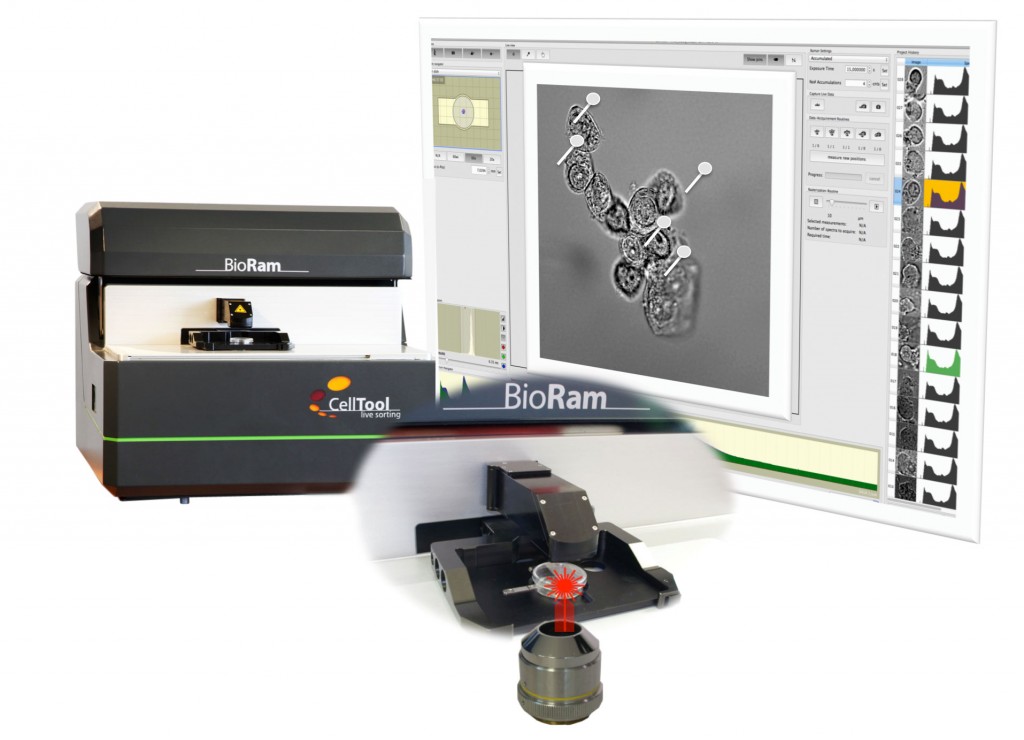
Fig. 1 BioRam® – the cell and user friendly Raman microscope system (CellTool, Bernried, Germany) consists of an inverted microscope platform with a motorized sample holder and integrated 785?nm Raman spectroscope. The Raman laser is focused through the objective to a spot size of about 1?µm in diameter. Application specific software facilitates spectra retrieval and supports data processing.
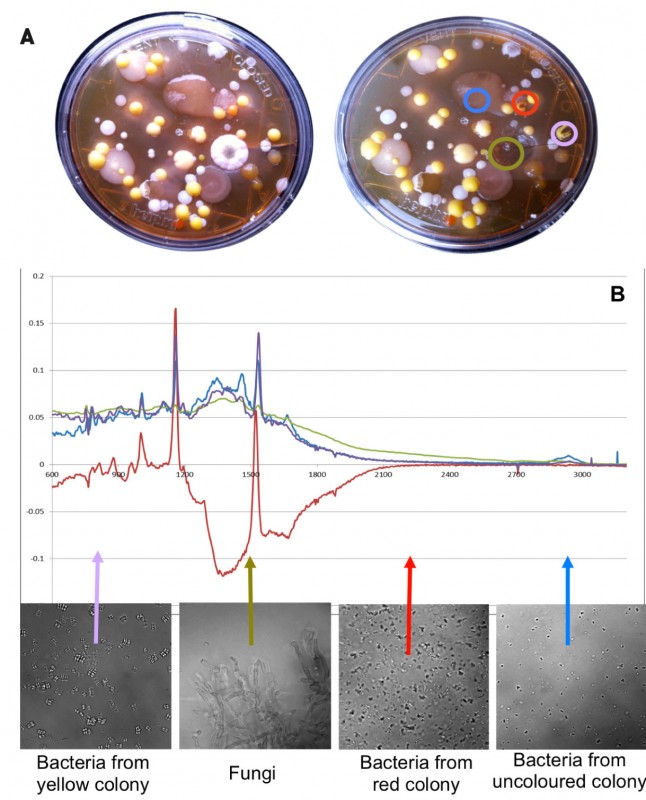
Fig. 2 Raman spectra from airborne microorganism. Colonies were scraped off the Agar plate A and resolved in buffer. B: Raman spectra were taken from individual living bacteria and fungi utilizing the simultaneous trapping effect of the Raman Laser configuration. Raman spectra of colored colonies differ at wavenumbers corresponding to carotenoids.
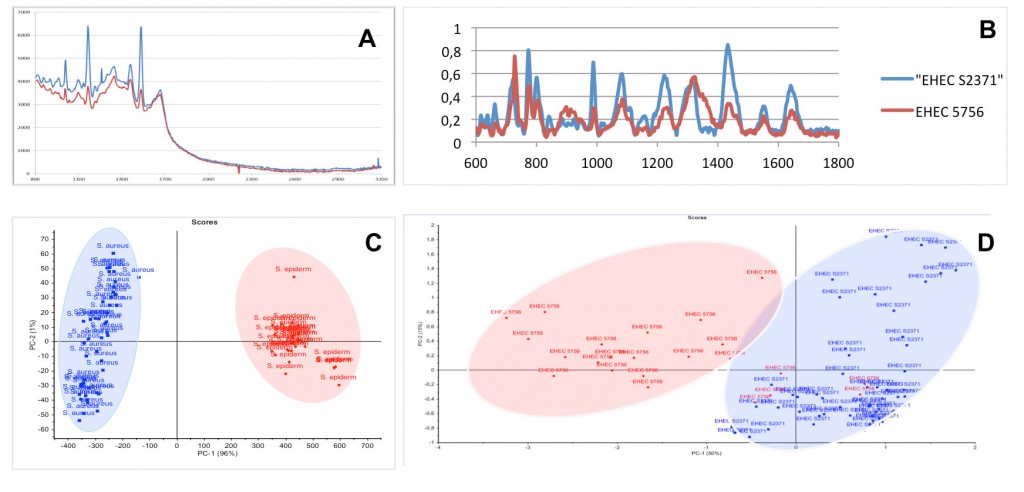
Fig. 3 Mean Spectra of Staphylococcus aureus (blue) and epidermidis (red) as well as of EHEC strains EHEC S2371 (blue) and EHEC 5756 (red) with the corresponding Principal Component Analysis, respectively (C and D).
Raman spectroscopy could be another one of those emerging highly physical technologies that most probably once will be commonly used in the hospital to support the pathologist at appraisal of tissue sections [1], to find patient-specific most effective anticancer drugs or to assist the surgeon during operation for minimal tumor tissue extraction [2]. Raman microscopy can also identify bacteria as each has a distinct Raman spectrum [3]. This could speed-up pathogen identification and may provide great impact on sepsis treatment [4].
For decades Raman spectroscopy was the domain of physicist, chemists as well as pharmacists, who used Raman spectroscopy to investigate or to proof quality of alloys, metals, pure substances and compounds. They also measured spectra of almost anykind of isolated and purified biomolecules. It was never expected that Raman spectroscopy could also characterize biological cells, which are composed of thousands of molecules of various kinds and concentrations undergoing a permanent changeover.
The advantage of Raman spectroscopy is its sensitivity as well as the feasibility to work within fluidics. This provides a wide range of possibilities in biological research and medical applications. In particular, Raman microscopy enables simultaneous investigation of cellular components and gives insight into the cells metabolism in a completely non-destructive way. Thus, changes in molecular composition and activation can be measured coming along with cell cycle, cell differentiation or induced by drug exposure or environmental impact. Raman microscopy identifies and analyzes cells with a high degree of precision and specificity – without the need of biochemical markers, fluorescent labels, antibodies or beads. Most importantly Raman microscopy works within liquids and thus living cells can be investigated under culture conditions leaving them unaffected and preserved for further use.
Facts and potential
In recent years numerous publications appeared that clearly demonstrated the feasibility of Raman microscopy to identify and examine cells. In most cases a physicist having a Raman system available collaborated with a biologist or clinician who provided the samples. In spite of promising results Raman spectroscopy did not yet make its way into routine cell analysis and clinical diagnostics. This is mainly due to extra preparation that is required to mount the cells onto special substrates that have high spectroscopic quality but are not appropriate for routine cell analysis work. Cells do not necessarily like to seed on those substrates, simultaneous microscopic observation might be hindered or these substrates are simply too expensive to be suited as consumables. Furthermore, special expertise from a physicist is required to operate the complex Raman systems and expert knowledge is necessary to process and interpret the spectra for meaningful conclusions.
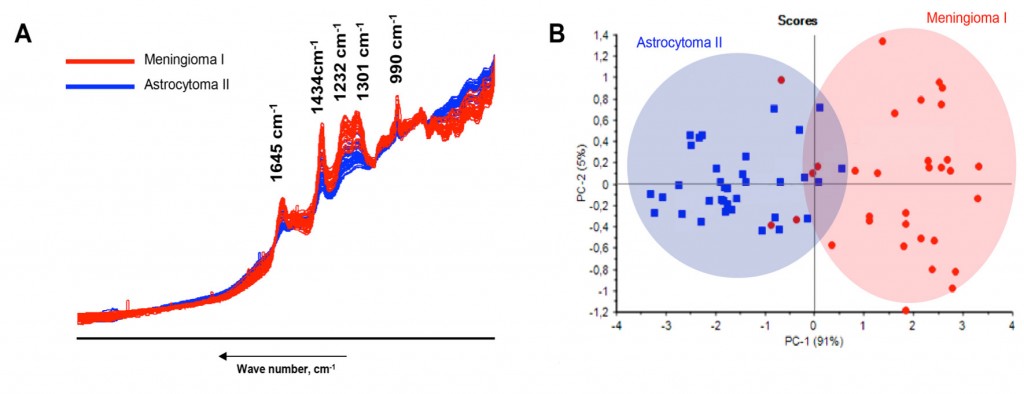
Fig. 4 A – Comparison of Raman spectra recorded from 40 different cells of paraffin embedded and deparaffinized sections of Astrocytoma grade II (blue) and Meningioma Grade I (red) tumors. B – Principle Component Analysis (PCA) of Raman spectra depicts obvious separation of the two populations C – Corresponding tissue sections of the tumors stained with Hematoxylin and Eosin (HE).
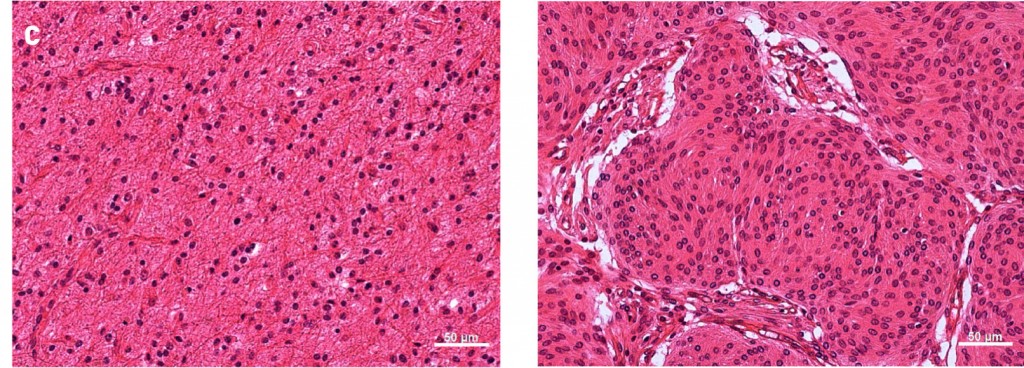
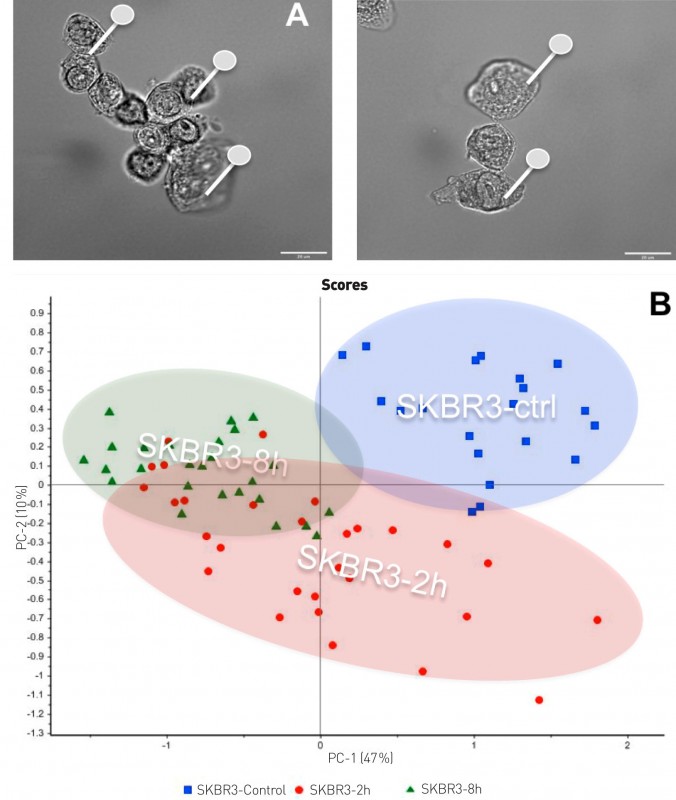
Fig. 5 Monitoring of Herceptin uptake – A: bright field images of SKBR3 tumor cells. Pins demonstrate site of Raman measurement. B: PCA-Plot of untreated control (blue) and two time points at 2 (red) and 8 (green) hours of incubation, respectively. Distinct clusters show that cells react on Herceptin treatment resulting in change of molecular features.
Unmet need for daily routine
A “bio-compatible” Raman system is required to fill the gap between laboratory bench-top studies and clinical diagnosis. The biologists and technicians need a tool that can be integrated in routine lab work. A straight forward and easy to use device that match the requirements of cell culture and cell biological work as well as tumor diagnostics would be of great interest. Cells cultured in common culture ware or on routine glass slides should be able to be investigated by Raman microscopy without further preparation steps.
The solution – a Raman Microscope for biologists and physicians
That was our intension to develop the BioRam® (CellTool GmbH, Bernried, Germany), a Raman trapping microscope system, where all the complex Raman related issues are running in the background. There is no need for the user to interfere with this “black-box”. Thus, laser based Raman microscopy is as easy as fluorescence or laser scanning microscopy. The applied 785nm laser wavelength is well tolerated by living cells. Various inserts have been designed to hold culture dishes, multiwell-slides, microtiter-plates or up to three glass slides to analyze serial tissue sections. The inverted microscope platform allows safe and comfortable working with living cells cultured in media.
Specimen are simply placed on the microscope table and observed using bright field illumination. Cells adherently growing can be pin-pointed prior to automated spectra retrieval. The microscope table moves with high precision from cell to cell. Focusing of the Raman laser beam through the objective generates a focal spot of about 1µm in diameter, depending on the objective magnification. This enables to distinguish between cytoplasm or nucleus – depending on the experiment and questions to be answered (Fig.1). On the other hand, focusing of the laser beam generates an electromagnetic gradient along which microorganism or cells in suspension are aligned and driven towards the laser focus, where they are trapped during Raman spectra retrieval. User defined cell ore tissue areas can also automatically be screened.
The application-oriented operation and data processing software allows quick access to the required spectral information of cell state and fate. As a special requirement in biomedical application we have to deal with routine glass slides and the corresponding fluorescence. Therefore, an algorithm was developed to subtract the glass background from the spectral data. For spectra interpretation data are processed applying customized data processing software. Data analysis is performed with the Unscrambler® statistical software (Camo, Norway) using “principal component analyses” (PCA), the most common statistic tool for the analysis of spectral data.
Living microorganism
As proof of concept we measured Raman spectra of living airborne microorganism grown on an Agar plate [Fig.2A] that was opened for about 2 minutes and incubated at room temperature for five days. Some of the sprouted colonies [Fig. 2a] were scraped off and diluted in 0.9% NaCl buffer. Raman spectra of individual single specimen were taken from exploiting the trapping effect to hold them within the laser focus during spectra retrieval. Spectra from the examined samples clearly differ. Especially bacteria from the colored colonies show prominent peaks at wavenumbers (i.e. wavelength-1) corresponding to carotenoids. Here of course the samples as well as the related spectra are so different that they can be discriminated by eye.
But also similar specimen such as bacterial strains staphylococci aureus and epidermidis [5] as well as subpopulation of EHEC bacteria could be discriminated using Raman microscopy. In Fig. 3 mean Raman spectra and the related Principal Component Analysis (PCA) are demonstrated. PCA-plots visualize each individual measured spectrum as a dot transferred from n-dimensional data room towards a 2-dimensional graph. When spectra cluster within distinct areas this means that the investigated populations differ from each other. One significant difference between Staphylococcus strains again is due to carotenoids.
In summary the BioRam® measures living bacteria quick and easy and might become a valuable tool in fast pathogen identification and resistance testing providing specific information without special preparation.
Cancer research and tumor diagnosis
Cancer is still one of the most common causes of death and only little is known about its origin. Meanwhile strong effort is spend on early diagnosis of diseased cells to avoid tumor development. The potential of Raman microscopy in clinical oncology was emphasize by Fenn et al. [6] who summarized recent research work on different cancer types. Chen et al. [7] identified Raman microscopy as promising clinical analytical technique for rapid and non-destructive diagnosis of human diseases. However, for clinical use a dedicated Raman system is required to enable routine access to Raman spectra.
We used the BioRam® system to investigate cell stages such as apoptosis and necrosis and to analyze lymphoma lines derived from Hodgkin lymphoma and to compare them to non-Hodgkin lymphoma cells. [8,9]. Clear discrimination of cell state and fate and even tumor subpopulations could be demonstrated. Raman spectrosocpy also could follow glioblastoma cells invading into engineered neural tissue to study aggressiveness of the brain tumor [8].
Brain Tumors
Primary brain tumors constitute approximately 5% of human neoplasia and roughly half of these tumors are malignant. The variation among brain tumors is very high with currently approximately 100 variants being recognized. We compared Raman spectra from two very different brain tumor entities, namely meningioma and astrocytoma. In brief, routinely processed paraffin embedded samples from meningioma and astrocytoma each were cut into 5µm slices, deparaffinized and submitted to Raman microscopy. At least 40 Raman spectra were analyzed from each tissue sample. We detected clear differences between the spectra of meningioma and astrocytoma (Figure 4 A and B). These findings together with the reports of other scientists [10] point towards the potential of Raman microscopy to recognize individual brain tumor types and warrants further exploration. Especially the power of Raman spectroscopy may have great potential for intraoperative decisions. This needs to be tested on fresh frozen cryostat sections.
Follow drug effectiveness
Furthermore, we wanted to test the sensitivity of Raman microscopy to follow the uptake of drugs in cancer cells. Therefore, cells of Herceptin-positive breast cancer cell line SKBR3 were exposed to the anti-cancer drug Herceptin (20µg/ml). Raman spectra of different time points yield distinct clusters as shown in Fig 5B. Analyzing the most prominent differences in Raman spectra yield three wavenumber areas corresponding to Amid I (at wavenumber 1660cm-1), lipids and proteins (at wavenumber 1450cm-1) as well as Phenylalanine (at wavenumber 1003cm-1). These results demonstrate the feasibility of Raman microscopy to follow internal changes of the metabolism of cells as reaction on drug application and to even allocate the molecules responsible for the change.
Potential for clinical practice
These investigations show that Raman spectroscopy has huge potential to support clinical diagnostics, assist minimal invasive surgery and to facilitate patient specific therapy. Using this label-free and non-invasive spectroscopic method cancer cells might be detected earlier and even unknown types of tumor cells might be discovered, not possible so far due to missing labels and markers. Further investigation need to be done to prove reliability and potential of this promising technique. It need to be investigated how early Raman can detect tumor cells and how fine tumor staging and grading will be possible. The existence of a dedicated “cell- and user-friendly” BioRam® system as well the availability of a service lab for Raman analysis of cells and tissue may greatly facilitate the introduction of this ubiquitous technology into clinical routine.
Happy cells – healthy people
Bibliography:
[1] �Diem, M. et al. (2013) J. Biophotonics 6, 11–12, 855–886
[2] Mayerhöfer, T. et al. (2014) Labor&More, 3.14 45-48
[3] Bolwien et al. (2008) Biomedical Optical Spectroscopy, Proc. of SPIE, 6853, 68530F,
[4] Neugebauer, U. et al. (2014) J. Biophotonics 7, 3–4, 232–240
[5] Schütze, K. et al. (2013) Photonics Lasers Med 2(4): 364–366
[6] Fenn, MB. et al.(2011) Adv Opt Technol 213783
[7] Chen, P. et al. (2011) Anal Methods 3, 1257–69.
[8] Koch, S. et al. ( 2013) Proc SPIE;8798: 87980J.
[9] Brauchle, E. et al. (2014) Nature, Scientific Reports, 4, 4698
[10] Gajjar, K. et al. (2013), Anal. Methods 5, 89–102
Acknowledgements:
Thanks to Dr. Christian Kölsche, Dr. Felix Sahm
and Dr. P.O. Frappart, Pathology Institute, University Heidelberg and Clinical Cooperation Unit Neuropathology, German Cancer Research Center Heidelberg for providing brain tumor samples and Dr. Wolfgang Mutter, Hyglos GmbH, Bernried for providing EHEC bacteria as well as Dr. Katharina Malinowsky for help with the breast cancer cells. Special thanks go to Dr. Steffen Koch for sharing his expertise in Raman spectra measurements and analysis.
This project has received funding from the European Union’s Seventh Programme for research, technological development and demonstration under grant agreement No 279288 as well as from “Photonics4Life” (P4L grant agreement no.: 224014m).
Picture: © CellTool GmbH
|