|
L&Mint-int-1-2015
>
lab&more in conversation with Dr Stefan Lamotte, Research Scientist, Separation Science & Hyphenated Techniques, Competence Center Analytics, BASF SE
lab&more in conversation with Dr Stefan Lamotte, Research Scientist, Separation Science & Hyphenated Techniques, Competence Center Analytics, BASF SEWanted: Universal detectabilityAnalytical procedures in the laboratory span a variety of chromatographic techniques such as high performance liquid chromatography (HPLC), gas chromatography (GC), supercritical fluid chromatography (SFC) and capillary electrophoresis (CE). Samples analyzed in the laboratory by HPLC are often non-volatile and without a chromophor, thus common UV detectors are not suitable. Alternatively, more universal detectors, based on aerosol techniques such as evaporative light scattering or charged aerosol can overcome this problem and needed to be evaluated especially for demanding surfactant analysis applications. 
lab&more in conversation with Dr. Stefan Lamotte, who evaluated Charged Aerosol Detection for the HPLC trace analysis of surfactants. Dr Lamotte, why did you decide to evaluate the Thermo Scientific Charged Aerosol Detector? S. Lamotte: Without talking too much about details, we needed to analyze several special surfactants by HPLC. These surfactants are used in advanced petrochemical processes. Our standard separation method is well established and robust, but the samples are quite challenging and the goal is to quantify the relevant surfactants in small elution window on a baseline that is significantly affected by the matrix load. Performing calibration and quantification, we noticed that the response curve was quite different to the ELSD. The ELSD calibration curve is more a quadratic function, while the one for CAD looks more like a root function Talking about the non-linear response of both detectors. With the Corona Veo RS, you have the possibility to obtain linear calibration curves by using the power function feature? Did you use that feature? S. Lamotte: In fact we did. Using the power function feature, we were able to nearly obtain linear calibration curves over a wide range. However, it required a significant amount of time to obtain the optimum power function values for our analytes and the power function can be different for each individual analyte. I would greatly appreciate a software tool to assist in this process. We also were wondering why the peak areas decreased with the increasing power function. This became clear when we understood the need of a normalization factor in the detector firmware to keep the response of high analyte concentrations in the operation range of the detector electronics. One of the main advantages of Charged Aerosol Detection and evaporative light scattering detection is their universality. Did you see any differences of universality between both techniques? S. Lamotte: We clearly observed more substances with the Corona Veo than with the other detection techniques including ELSD. In cases where you have highly complex matrices, it highlights the importance of achieving a good chromatographic separation as nearly all components can be observed. Dr Lamotte, thank you for the interview. The signal generation with the CAD (charged aerosol detection) technique is completely different from the ELSD (evaporative light scattering), though both detectors use nebulization to create an aerosol in the first place. In contrast to measuring light scattering properties of this aerosol as the ELSD does, the CAD measures an electric current resulting from a subsequent charging of the aerosol surface. As shown in figure 1, the supporting nitrogen gas is used both for nebulization and for transferring a defined charge to the aerosol surface. This is possible by ionization of the nitrogen in a corona discharge process and bringing it in contact with the aerosol in a collision chamber. With this process the resulting current signal is a strict function of the aerosol surface. 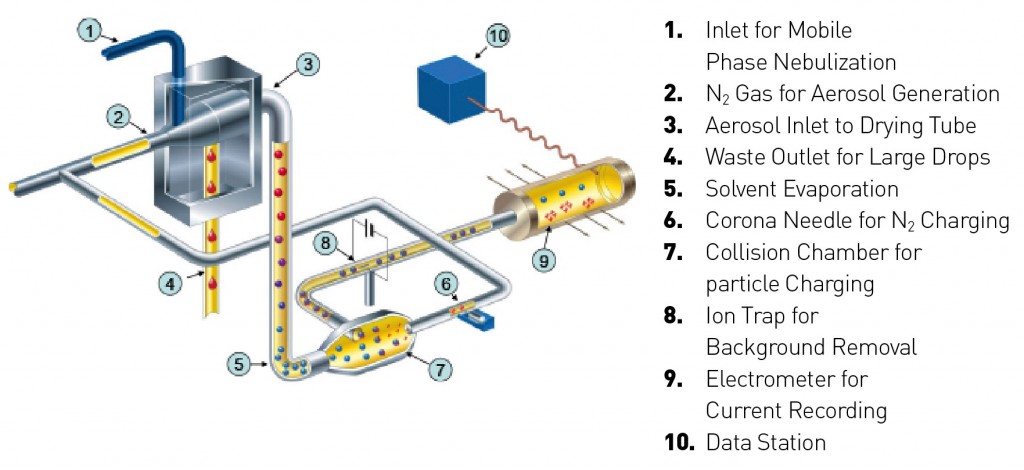
While the signal generation through a light scattering process in the ELSD is ruled by a complex combination of different scattering mechanisms that are mostly analyte-specific, it is controlled by simple geometrical relations in case of the CAD. As the size of the aerosol particles increases with the original analyte concentration (figure 2), the ratio of aerosol particle surface to particle mass decreases respectively. This fact together with the strict relationship between aerosol surface area and resulting electric current has three major consequences: 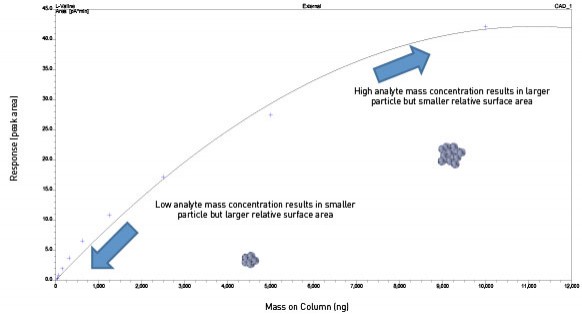
// 1. Among all HPLC detectors on the market, the CAD shows the most uniform response to a given analyte mass, independent of the specific chemical properties of non-volatile analytes. // 2. Since the surface to mass ratio increases with decreasing particle size resulting from decreasing analyte concentration, the CAD exhibits increasing sensitivity (slope of response curve) when moving towards trace concentrations. // 3. The resulting response curve type allows simple linearization by a mathematical signal transformation using a power function (figure 3). Such a straight forward linearization of calibration curves is not possible with an ELSD over a wider calibration range. 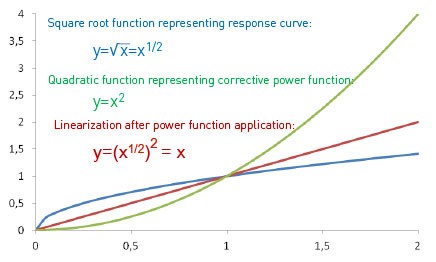
Picture: © istockphoto.com| akindo |
L&M int. 1 / 2015
Free download here: download here The Author: |
Search: