|
science
 >
What can analytics tell us?
>
What can analytics tell us?
What can analytics tell us?Nanoparticles in foodOver the last few years, legislation specifically governing the handling of nanomaterials (NMs) has been steadily expanded within the EU (Fig. 1). One example is the Food Information Regulation, which requires that food ingredients in the form of “engineered nanomaterials” must be clearly indicated in the list of ingredients. To produce accurate labelling – and to inspect and assess this labelling – clear definitions are required, alongside valid analytical methods. 
Basic orientation is provided by the broad definition for a NM given in Commission Recommendation 2011/696/EU. This Recommen- dation 2011/696/EU and the definitions given in specific legislation contain measurable aspects. One criterion listed is the size of the particles or the particle size distribution. A material is a NM if 50% or more of the particles in the number size distribution lie in the size range 1 to 100nm. Many challenges must still be overcome in the analysis and assessment of NMs – some of which result from the measurable aspects of these definitions. While the various measurement techniques that are suitable for determining sizes in the 1–100nm range are known, they have strengths and weaknesses depending on the measurement task involved and need to be further improved or made more specific to such tasks. These end results need to facilitate answers to the following questions:
I Is a material a NM? // Qualitative: Which nanoparticles does the sample contain? Here, a distinction may need to be made in terms of naturally-occurring particles, and the material formulation needs to be investigated. // Quan titative: How many particles does the sample contain? This requires a classification into size fractions, and a distinction between primary particles, agglomerates and aggregates. Requirements for the methods used to analyse nanomaterials The taking of samples is itself a potential source of error. As of this writing, there is no published research that focuses specifically on NM sampling and assesses whether the typical methods result in representative lab samples. In addition, little is known about the behaviour of NMs in industrial batches (for example) or in complex matrices such as foodstuffs. For lab work, it is generally necessary to adapt the methods to the respective materials: where manufacturers use additives or modify surface properties, materials can behave very differently even though the same declaration has been made for the “base” particle. This leads to a situation where labs create solutions specific to each sample, resulting in high labour costs per sample. The problem is aggravated by the fact that food contains many natural substances at nanoscale dimensions (globular proteins, carbohydrates) that must be separated out before measurement (especially if detection is non-specific). This places extra demands on sample pre-processing work. It is important not to disturb the particle distribution, for example. Once the materials have been successfully extracted from the matrix, analysis methods such as Dynamic Light Scattering (DLS) or Field-Flow Fractionation require the production of dispersions for measurement. Such dispersions must remain stable at least until measurement is complete. One must also remember that ultrasound treatments or the addition of stabilisers can have a major impact on the results.
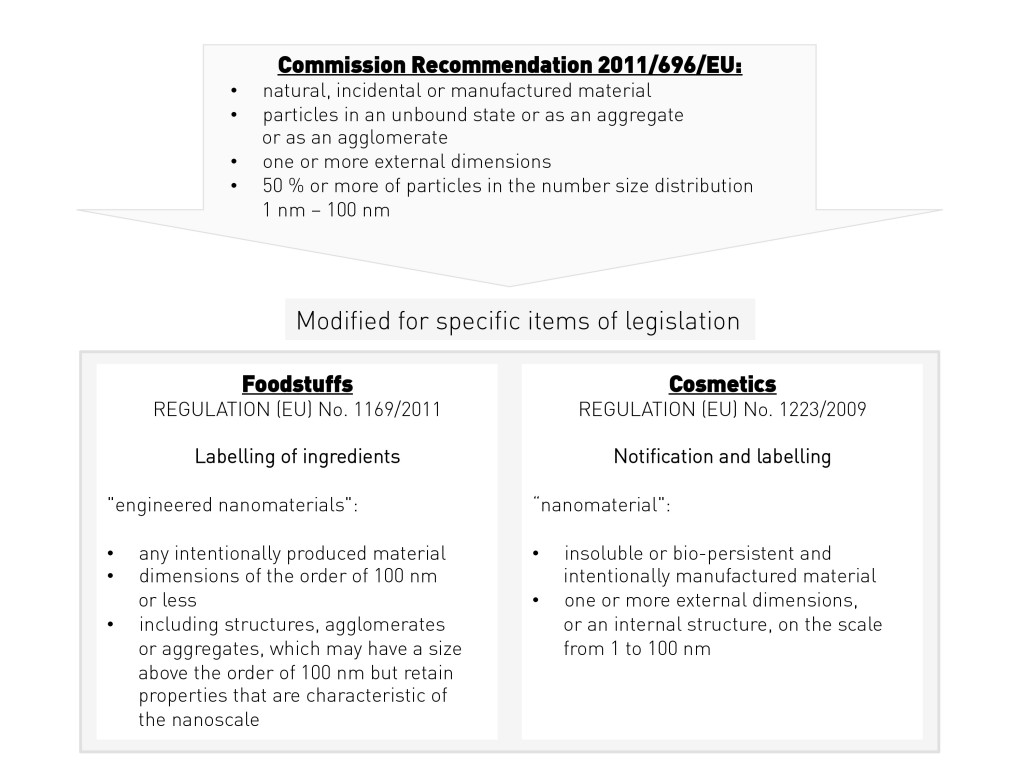
Fig. 1: Recommendation 2011/696/EU and its modification for specific items of legislation
Standards or generally defined and accepted performance requirements have not been established in this field to date. In-house validations are also made more problematic by the lack of standard/reference materials covering multiple size ranges. One validated method was recently published for the detection of silver nanoparticles in meat. As a rule, results must be valid for three parameters with reference to the respective matrix and NM, namely: identification of the material, size and size distribution [2]. For further details of requirements, the reader is referred to the reports published by the Joint Research Centre [3, 4, 5]. The kind of routine analyses familiar to us from established processes cannot yet be performed, for the reasons discussed above: in each case, the methods need to be modified to suit the specific analysis task (matrix and analyte). Interpreting the results to produce a final assessment is also problematic. Single-particle ICP-MS (SP-ICP-MS) can be performed rapidly and is therefore a method with the potential for routine application. Unlike standard ICP-MS measurements, SP-ICP-MS utilises a time-resolved analysis mode with short dwell times. With the sample appropriately diluted, individual signal events can therefore be detected, which correspond to single nanoparticles. By applying a spherical model together with a known particle density, number-based size distributions can be calculated. The method has the advantages of being highly specific and matrix-tolerant while being able to count a multitude of particles in a short analysis time (approx. 1min.) As a “counting method”, no conversions are needed for an assessment of the number size distribution in the sense of the definition. The problem of interferences places size detection limits on this measurement method, however. That said, SP-ICP-MS is ideal for use as an initial screening step before the application of more complex methods (examples are given below). To confirm results and perform complete characterisation of the NMs, suitable methods include electron microscopy techniques such as transmission electron microscopy. These kinds of imaging techniques make it possible to detect nano-objects such as agglomerates and distinguish these from primary particles. Automated image analysis and cheaper equipment are making such methods more suitable for use in routine practice. Asymmetrical Flow Field-Flow Fractionation (or AF4) uses a parabolic flow in a separation channel to separate particles by their size. The separation force is generated by cross flow perpendicular to the channel. This produces a vertical force field in opposition to the particles’ natural diffusion. Smaller particles thus enter areas of the channel with faster flow profiles and are therefore detected first. When combined with various online detectors, this non-destructive separation technique can enable the acquisition of important characterisation parameters. Particle size distribution can be determined with a suitable size calibration via the elution time or by using light scattering detectors (MALS or DLS). Detectors using mass spectrometry (ICP-MS) provide further details of the composition of inorganic NMs, offering both sensitivity and specificity. Quantitative analyses are also possible. As described, the multi-detector setup therefore enables the identification of the particles while also determining particle size/particle size distribution. When evaluating the results, however, one must bear in mind that the particle size distributions obtained are based on mass or intensity. Conversions to number-based distributions are currently subject to errors, however.
Bibliography |
L&M int. 3 / 2015
Free download here: download here The Author:Read more articles online


|
Search: